Blog
Announcing Apricot, a better way to subscribe to content
Social media has become the way to stay in the loop. News and long-form commentary, official government and corporate communications, educational content, professional development—it’s all on social media. Thing is, social media is also destroying lives and tearing society apart. Enter Apricot.
How to use PyTorch LSTMs for time series regression
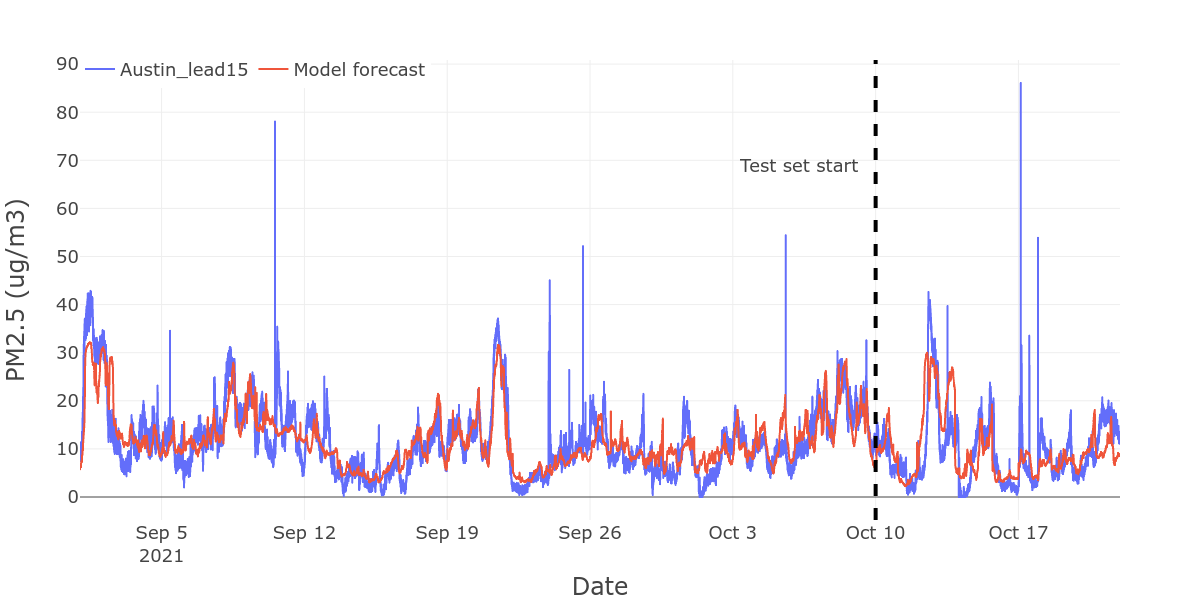
Most intros to LSTM models use natural language processing as the motivating application, but LSTMs can be a good option for multivariable time series regression and classification as well. Here’s how to structure the data and model to make it work.
Applications of survival analysis (that aren’t clinical research)
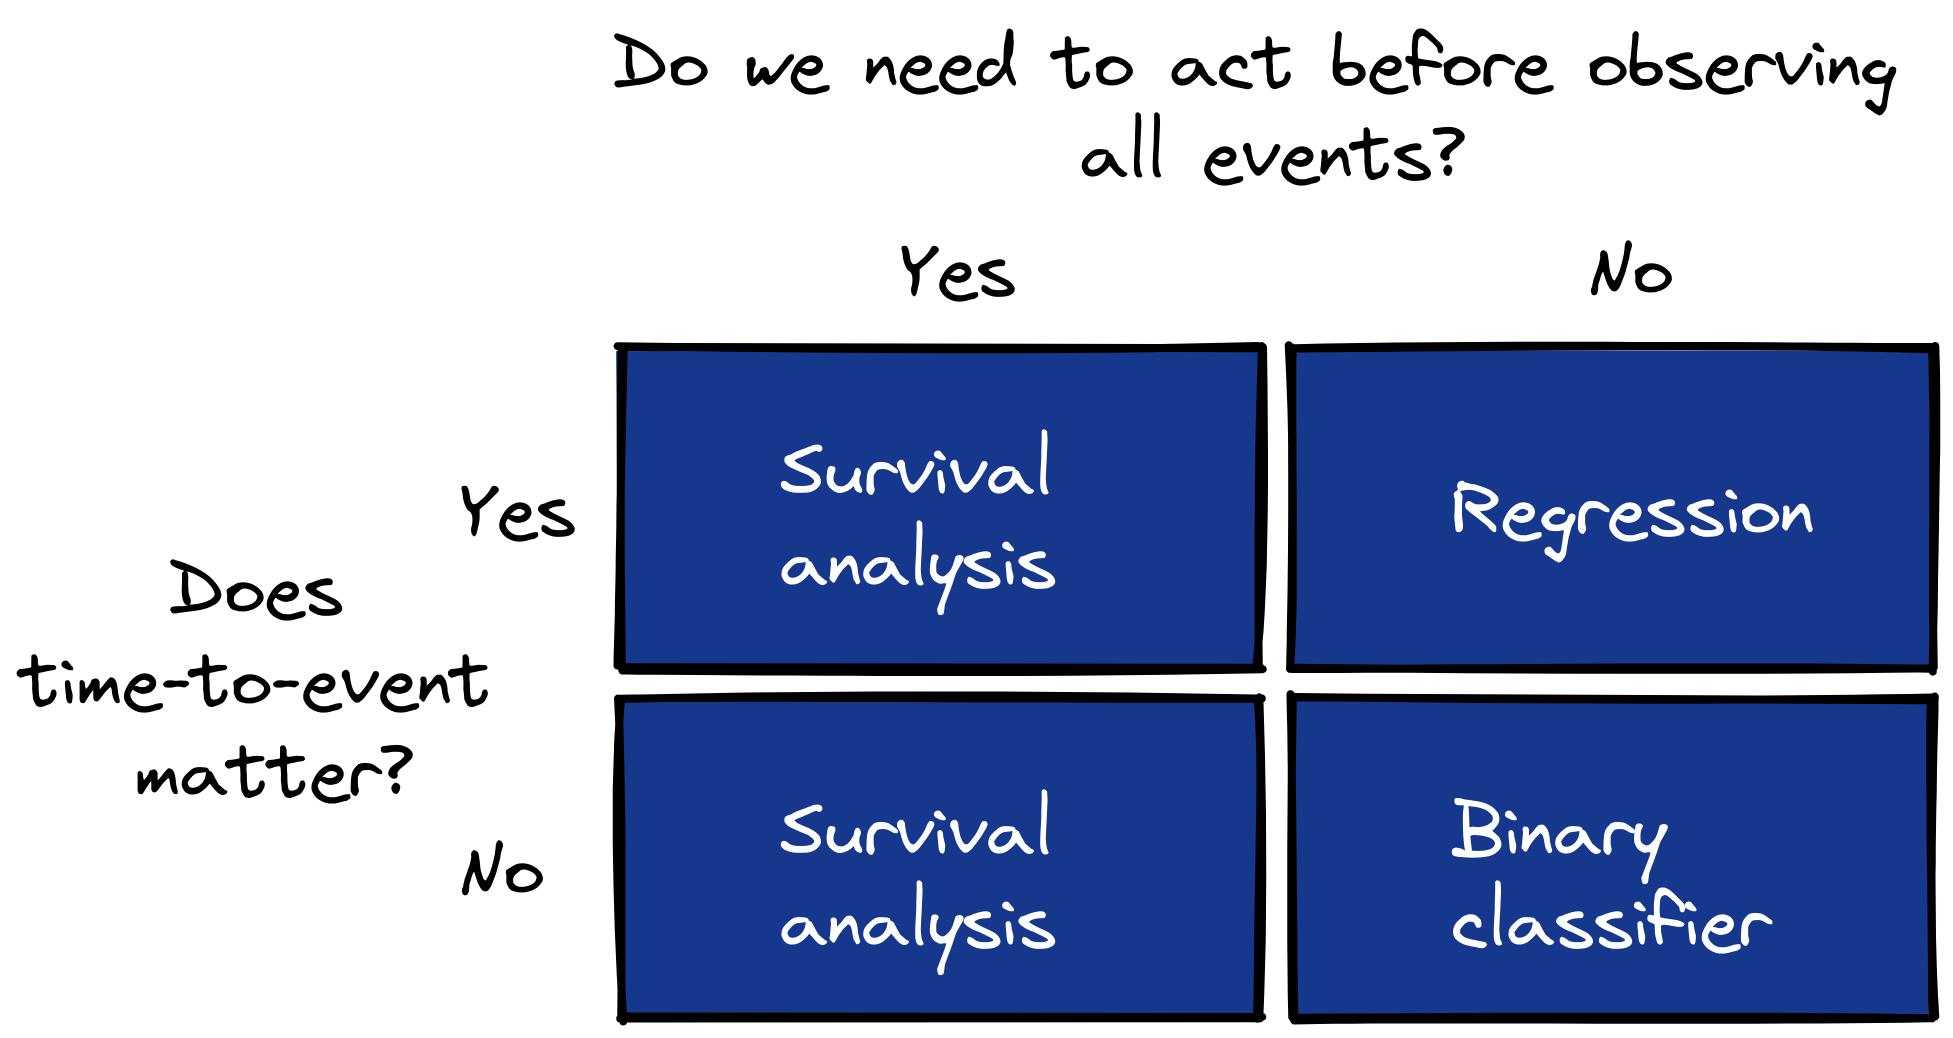
Survival analysis has been a standard tool for decades in clinical research, but data scientists in other domains have mostly ignored it. Here are some applications for which you might use survival analysis, to jump-start your creative data science engine.
How to compute Kaplan-Meier survival curves in SQL
Decision-makers often care how long it takes for important events to happen. In this article, I show how to compute Kaplan-Meier survival curves and Nelson-Aalen cumulative hazard curves directly in SQL, so you can answer time-to-event questions directly in your SQL-based analytics tables and dashboards.
How to construct survival tables from duration tables
The survival table is the workhorse of univariate survival analysis. Previously, I showed to build a duration table from an event log; now I show how to take the next steps, from duration table to survival table and estimates of survival and hazard curves.
A review and how-to guide for Microsoft Form Recognizer
Form Recognizer is Microsoft Azure’s answer to Amazon Textract and Google Form Parser for information extraction from form documents. I put all three to the test on a challenging set of invoice documents and was surprised to see Microsoft’s service come up short.
A review and how-to guide for Amazon Textract
At just two years old, Amazon Textract is already the grizzled veteran of the fast-moving information extraction-as-a-service market. I put it to the test against Google Form Parser and Microsoft Form Recognizer to see which service has the best speed, accuracy, and developer experience.
How to plot survival curves with Plotly and Altair
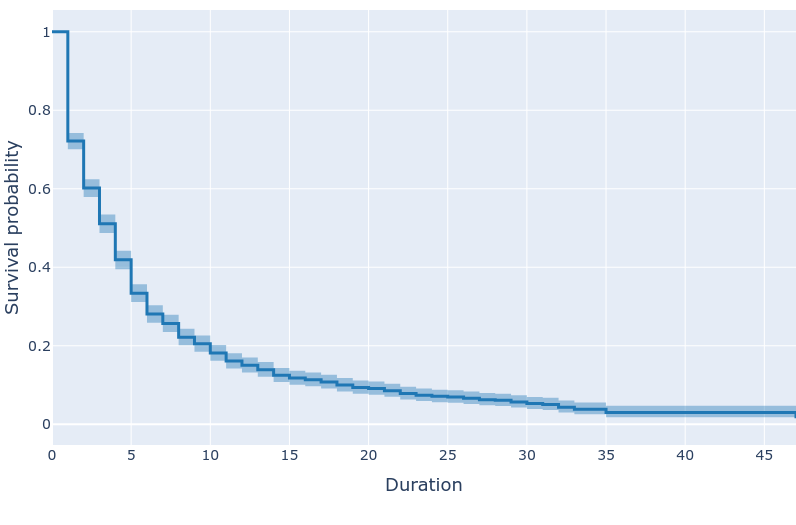
Survival curve plots are an essential output of survival analysis. The main Python survival analysis packages show only how to work with Matplotlib and hide plot details inside convenience functions. This article shows how to draw survival curves with two other Python plot libraries, Altair and Plotly.
Google Form Parser, a review and how-to
Google Form Parser is a new challenger in the information extraction arena, offering general-purpose off-the-shelf form extraction. We compared Form Parser to Amazon Textract and Microsoft Form Recognizer in terms of accuracy, speed, and ease of use. Take our code snippets and try it yourself!
How to build duration tables from event logs with SQL
Duration tables are a common input format for survival analysis but they are not trivial to construct. In our last article, we used Python to convert a web browser activity log into a duration table. Event logs are usually stored in databases, however, so in this article we do the same conversion with SQL.
How to convert event logs to duration tables for survival analysis
Survival models describe how much time it takes for some event to occur. This is a natural way to think about many applications but setting up the data can be tricky. In this article, we use Python to turn an event log into a duration table, which is the input format for many survival analysis tools.
A checklist for professionalizing machine learning models
Data scientists are drawn to the latest and greatest machine learning tasks and models, even though tabular binary classification remains the industry workhorse. We should take more pride in professionalizing the models that we know to work, rather than reflexively chasing every new thing.
Streamlit review and demo: best of the Python data app tools
Streamlit has quickly become the hot thing in data app frameworks. We put it to the test to see how well it stands up to the hype. Come for the review, stay for the code demo, including detailed examples of Altair plots.
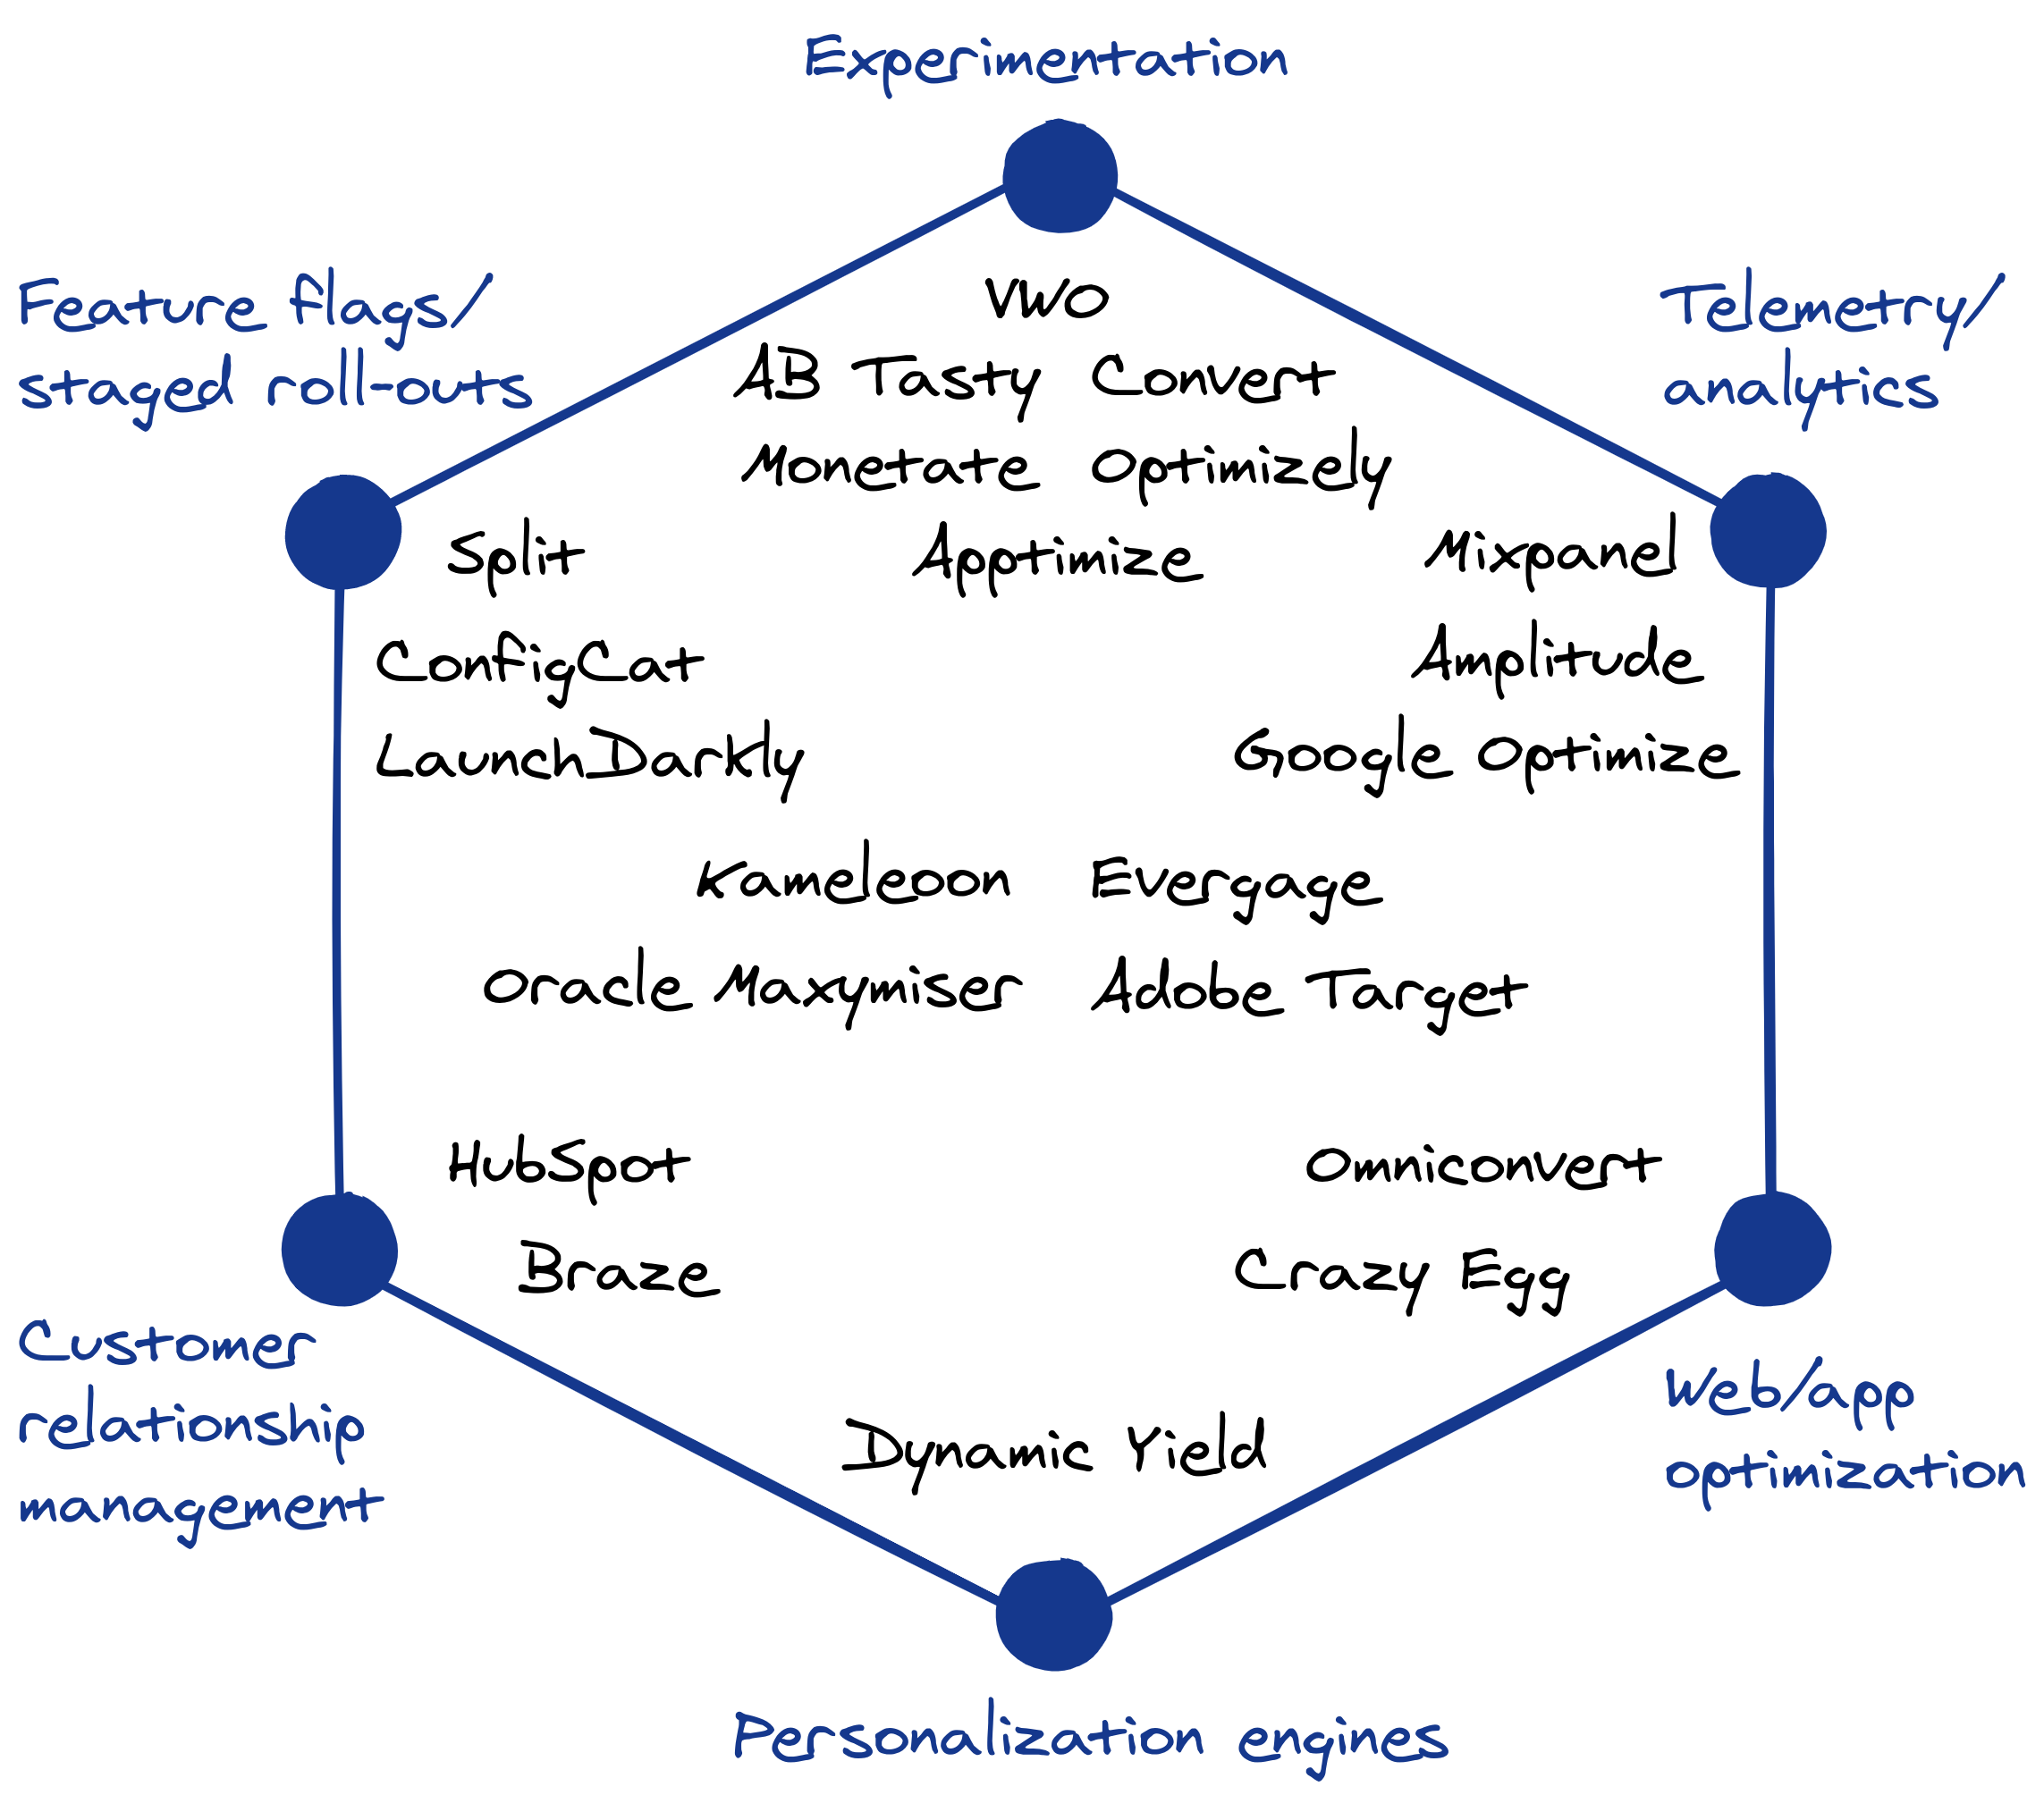
How to analyze a staged rollout experiment
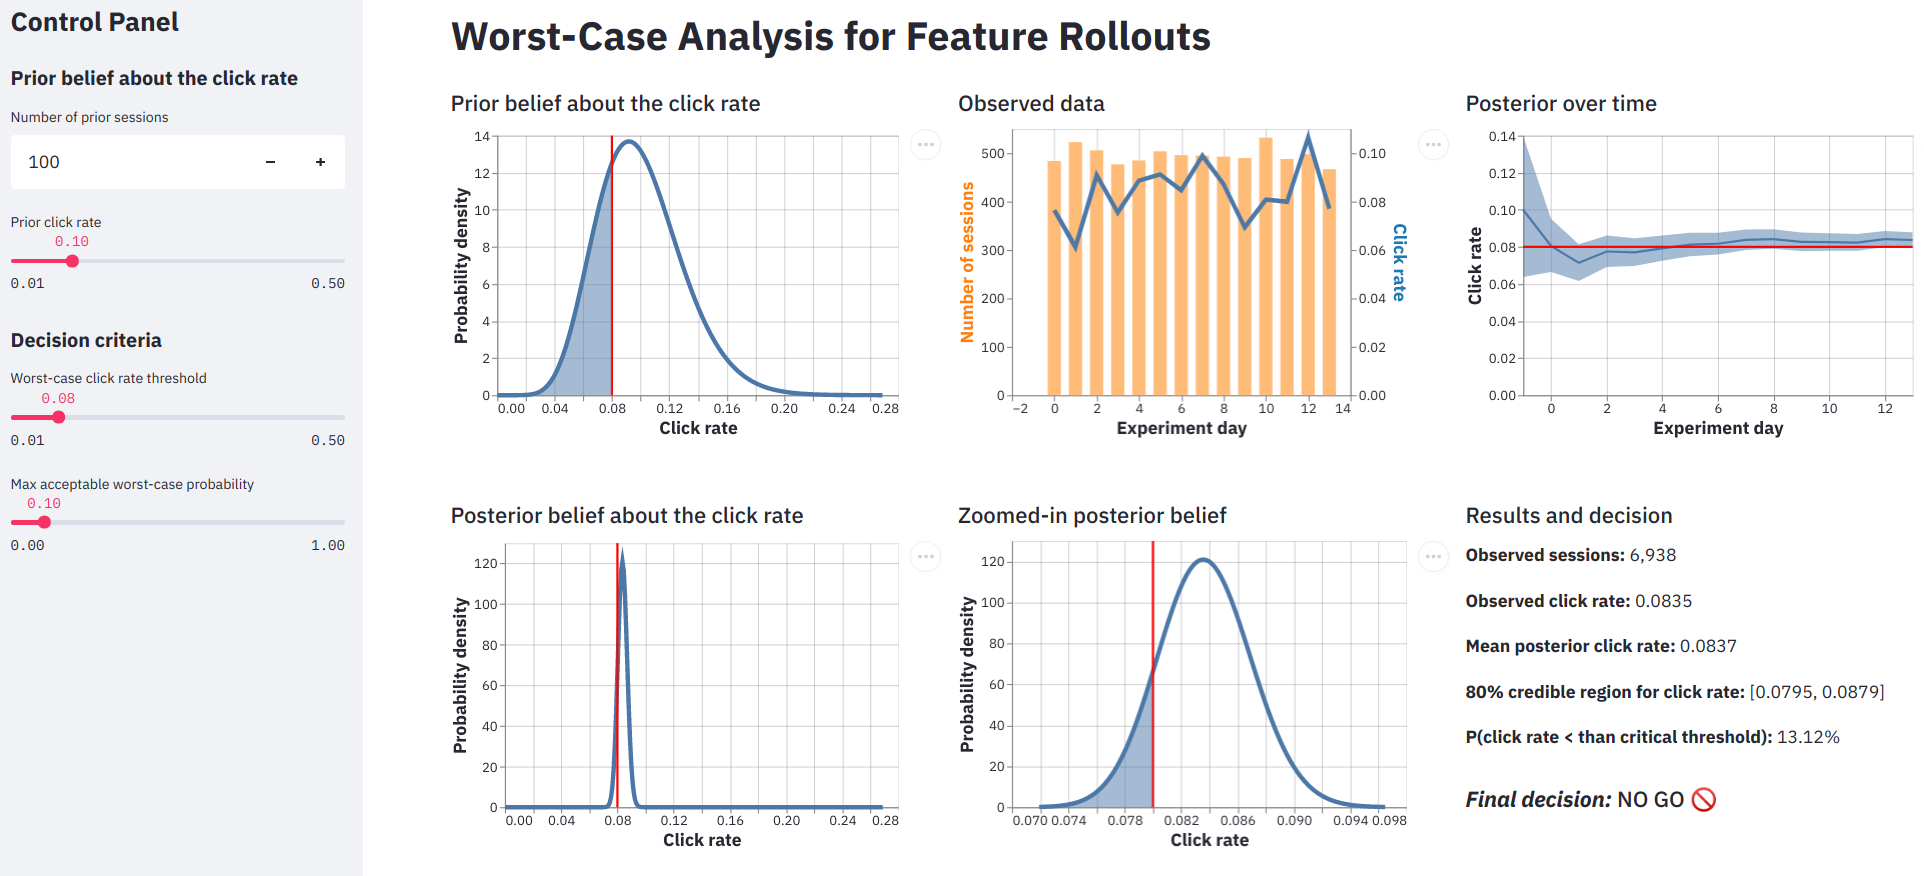
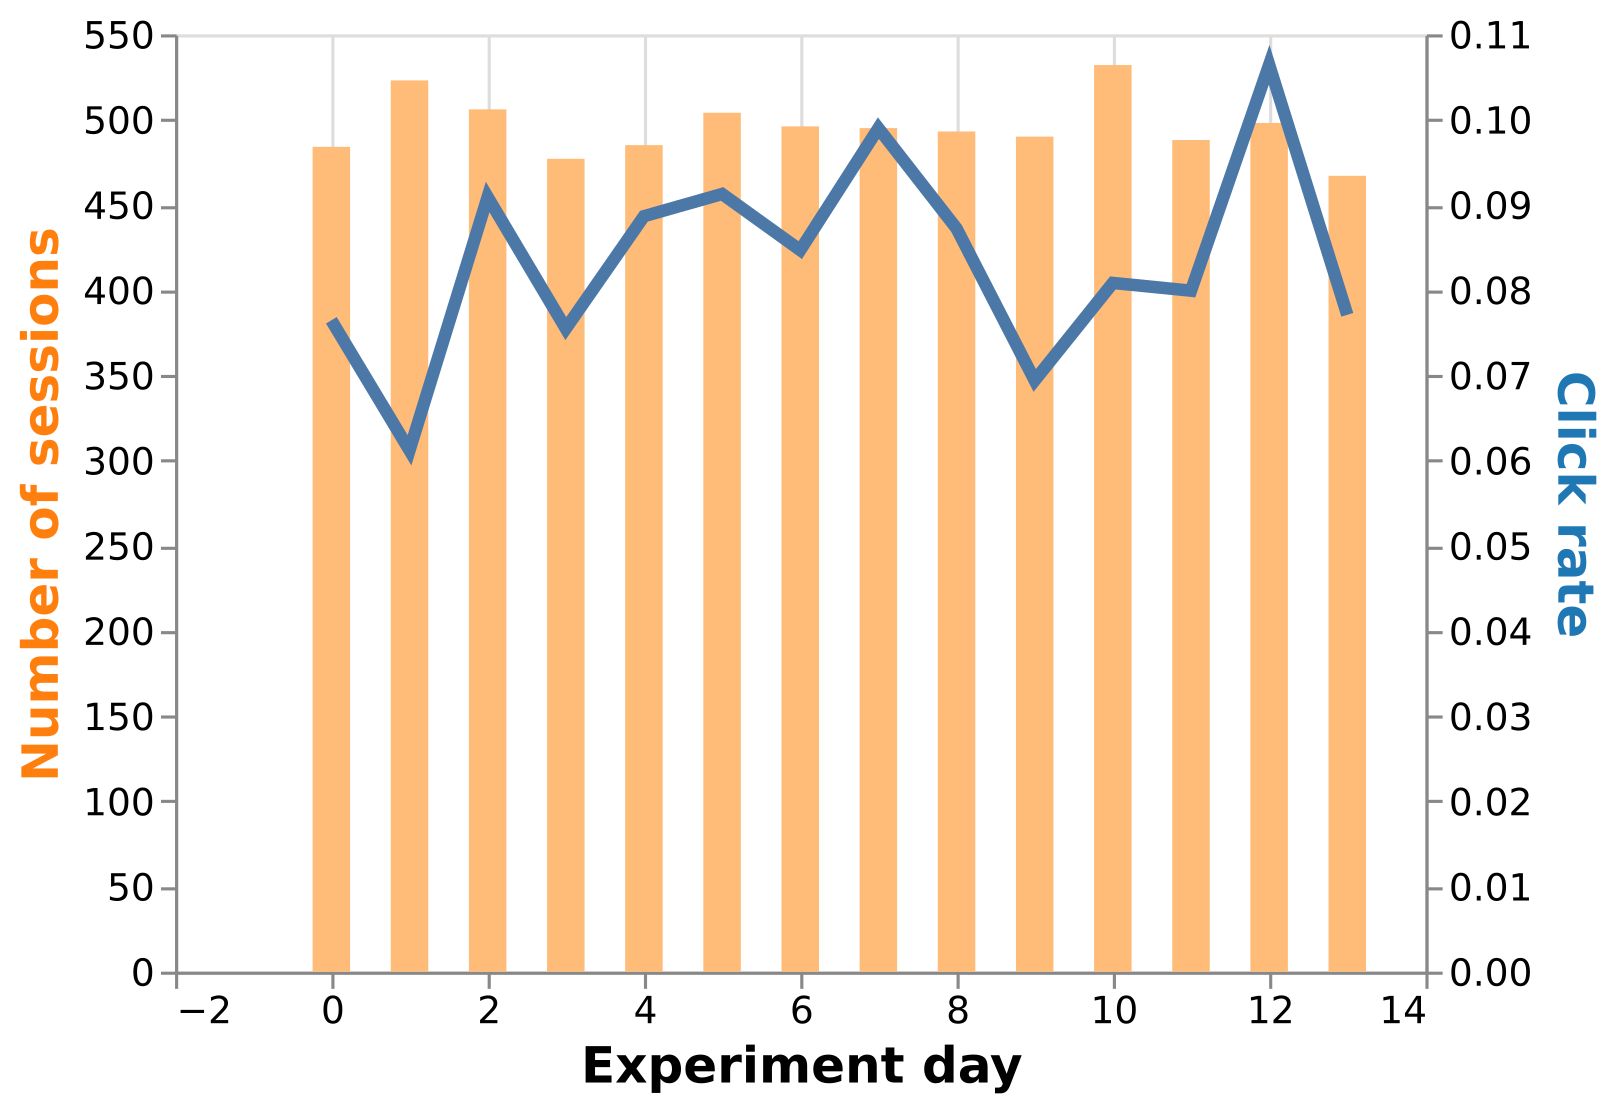
Recently we argued that confidence intervals are a poor choice for analyzing staged rollout experiments. In this article, we show a better way: a Bayesian approach that gives decision-makers the answers they really need. Check out our interactive Streamlit app first, then the article for the details.
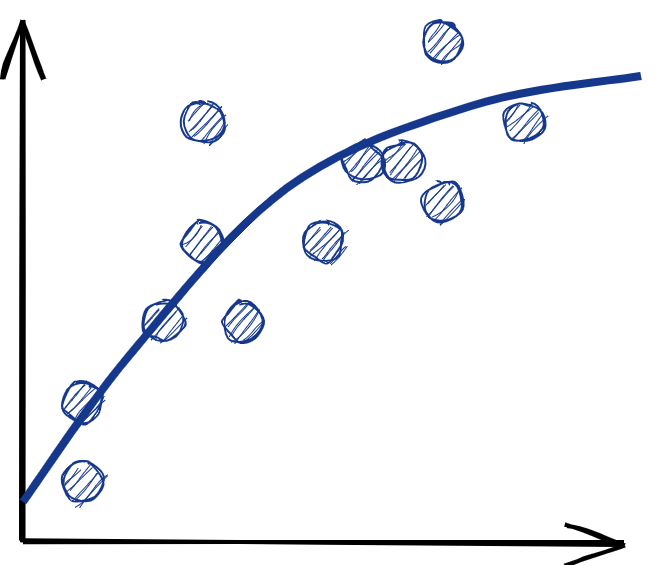
Research digest: what does cross-validation really estimate?
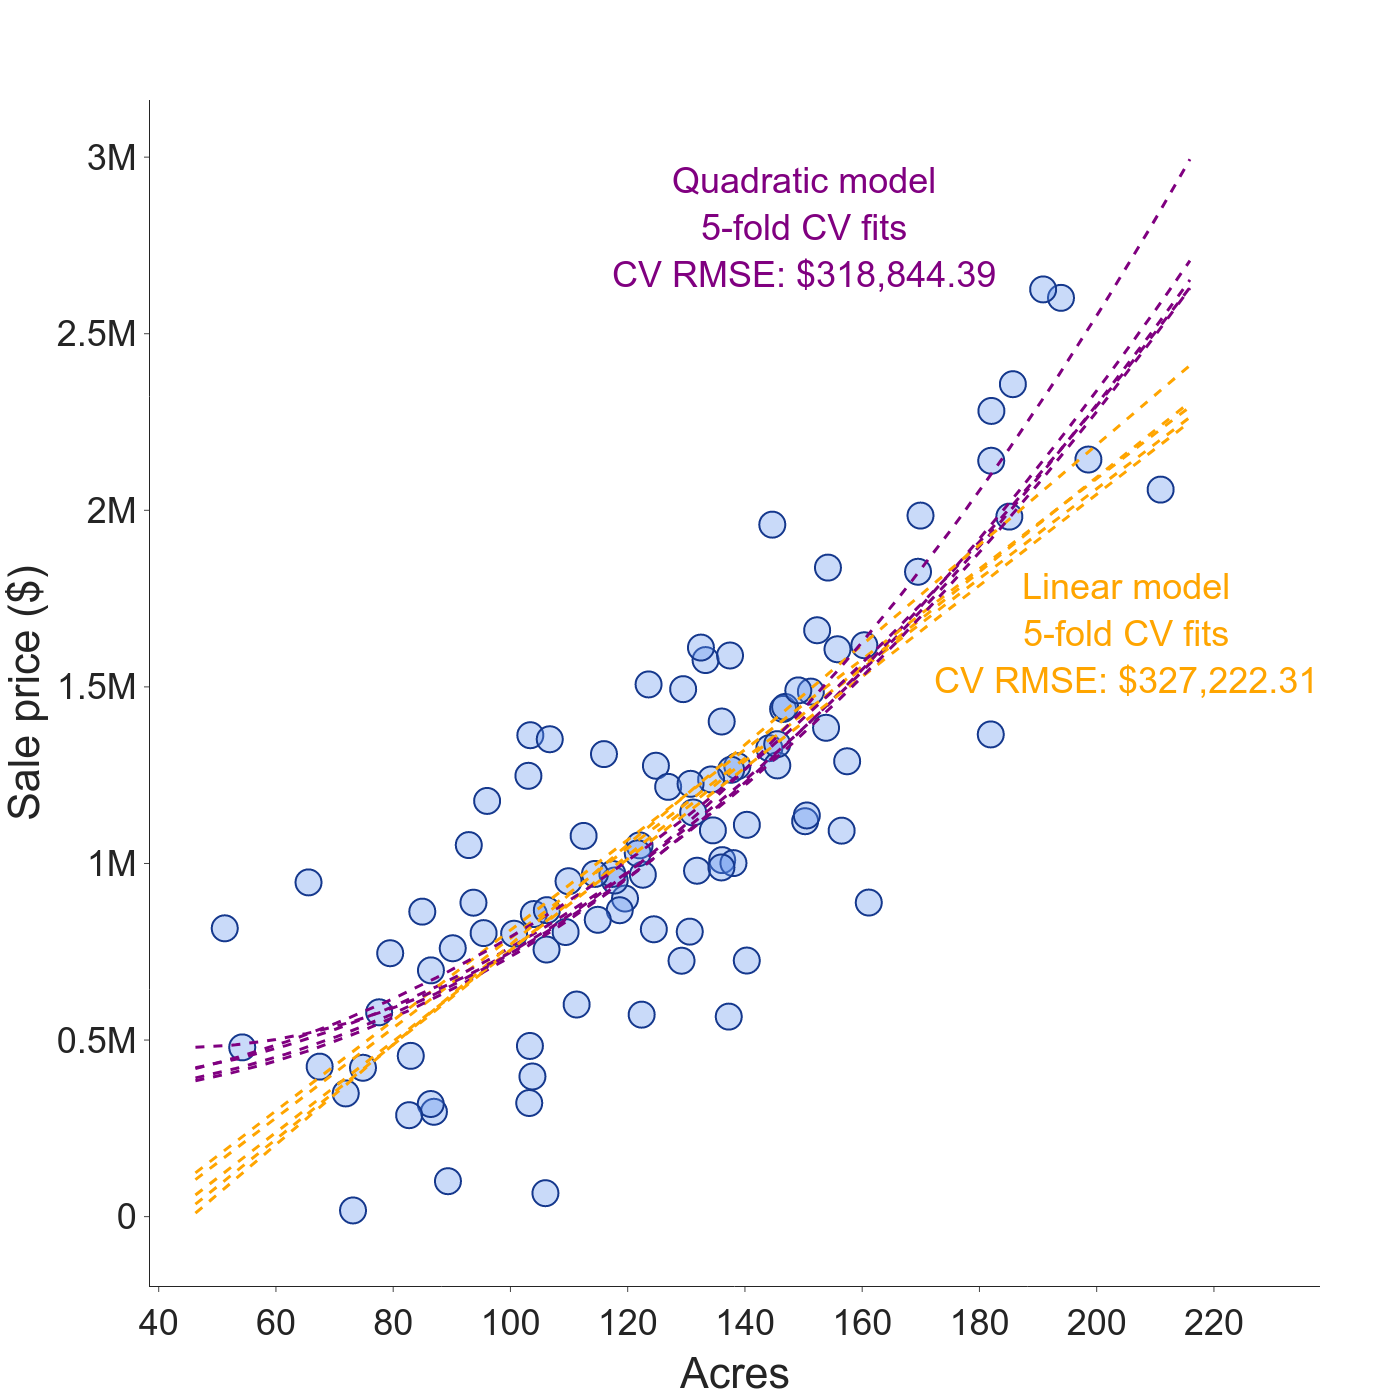
A new paper by Bates, Hastie, and Tibshirani reminds us that estimating a model’s predictive performance is tricky. For linear models at least, cross-validation does not estimate the generalization error of a specific model, as you would assume. How much does this matter for data science in practice?
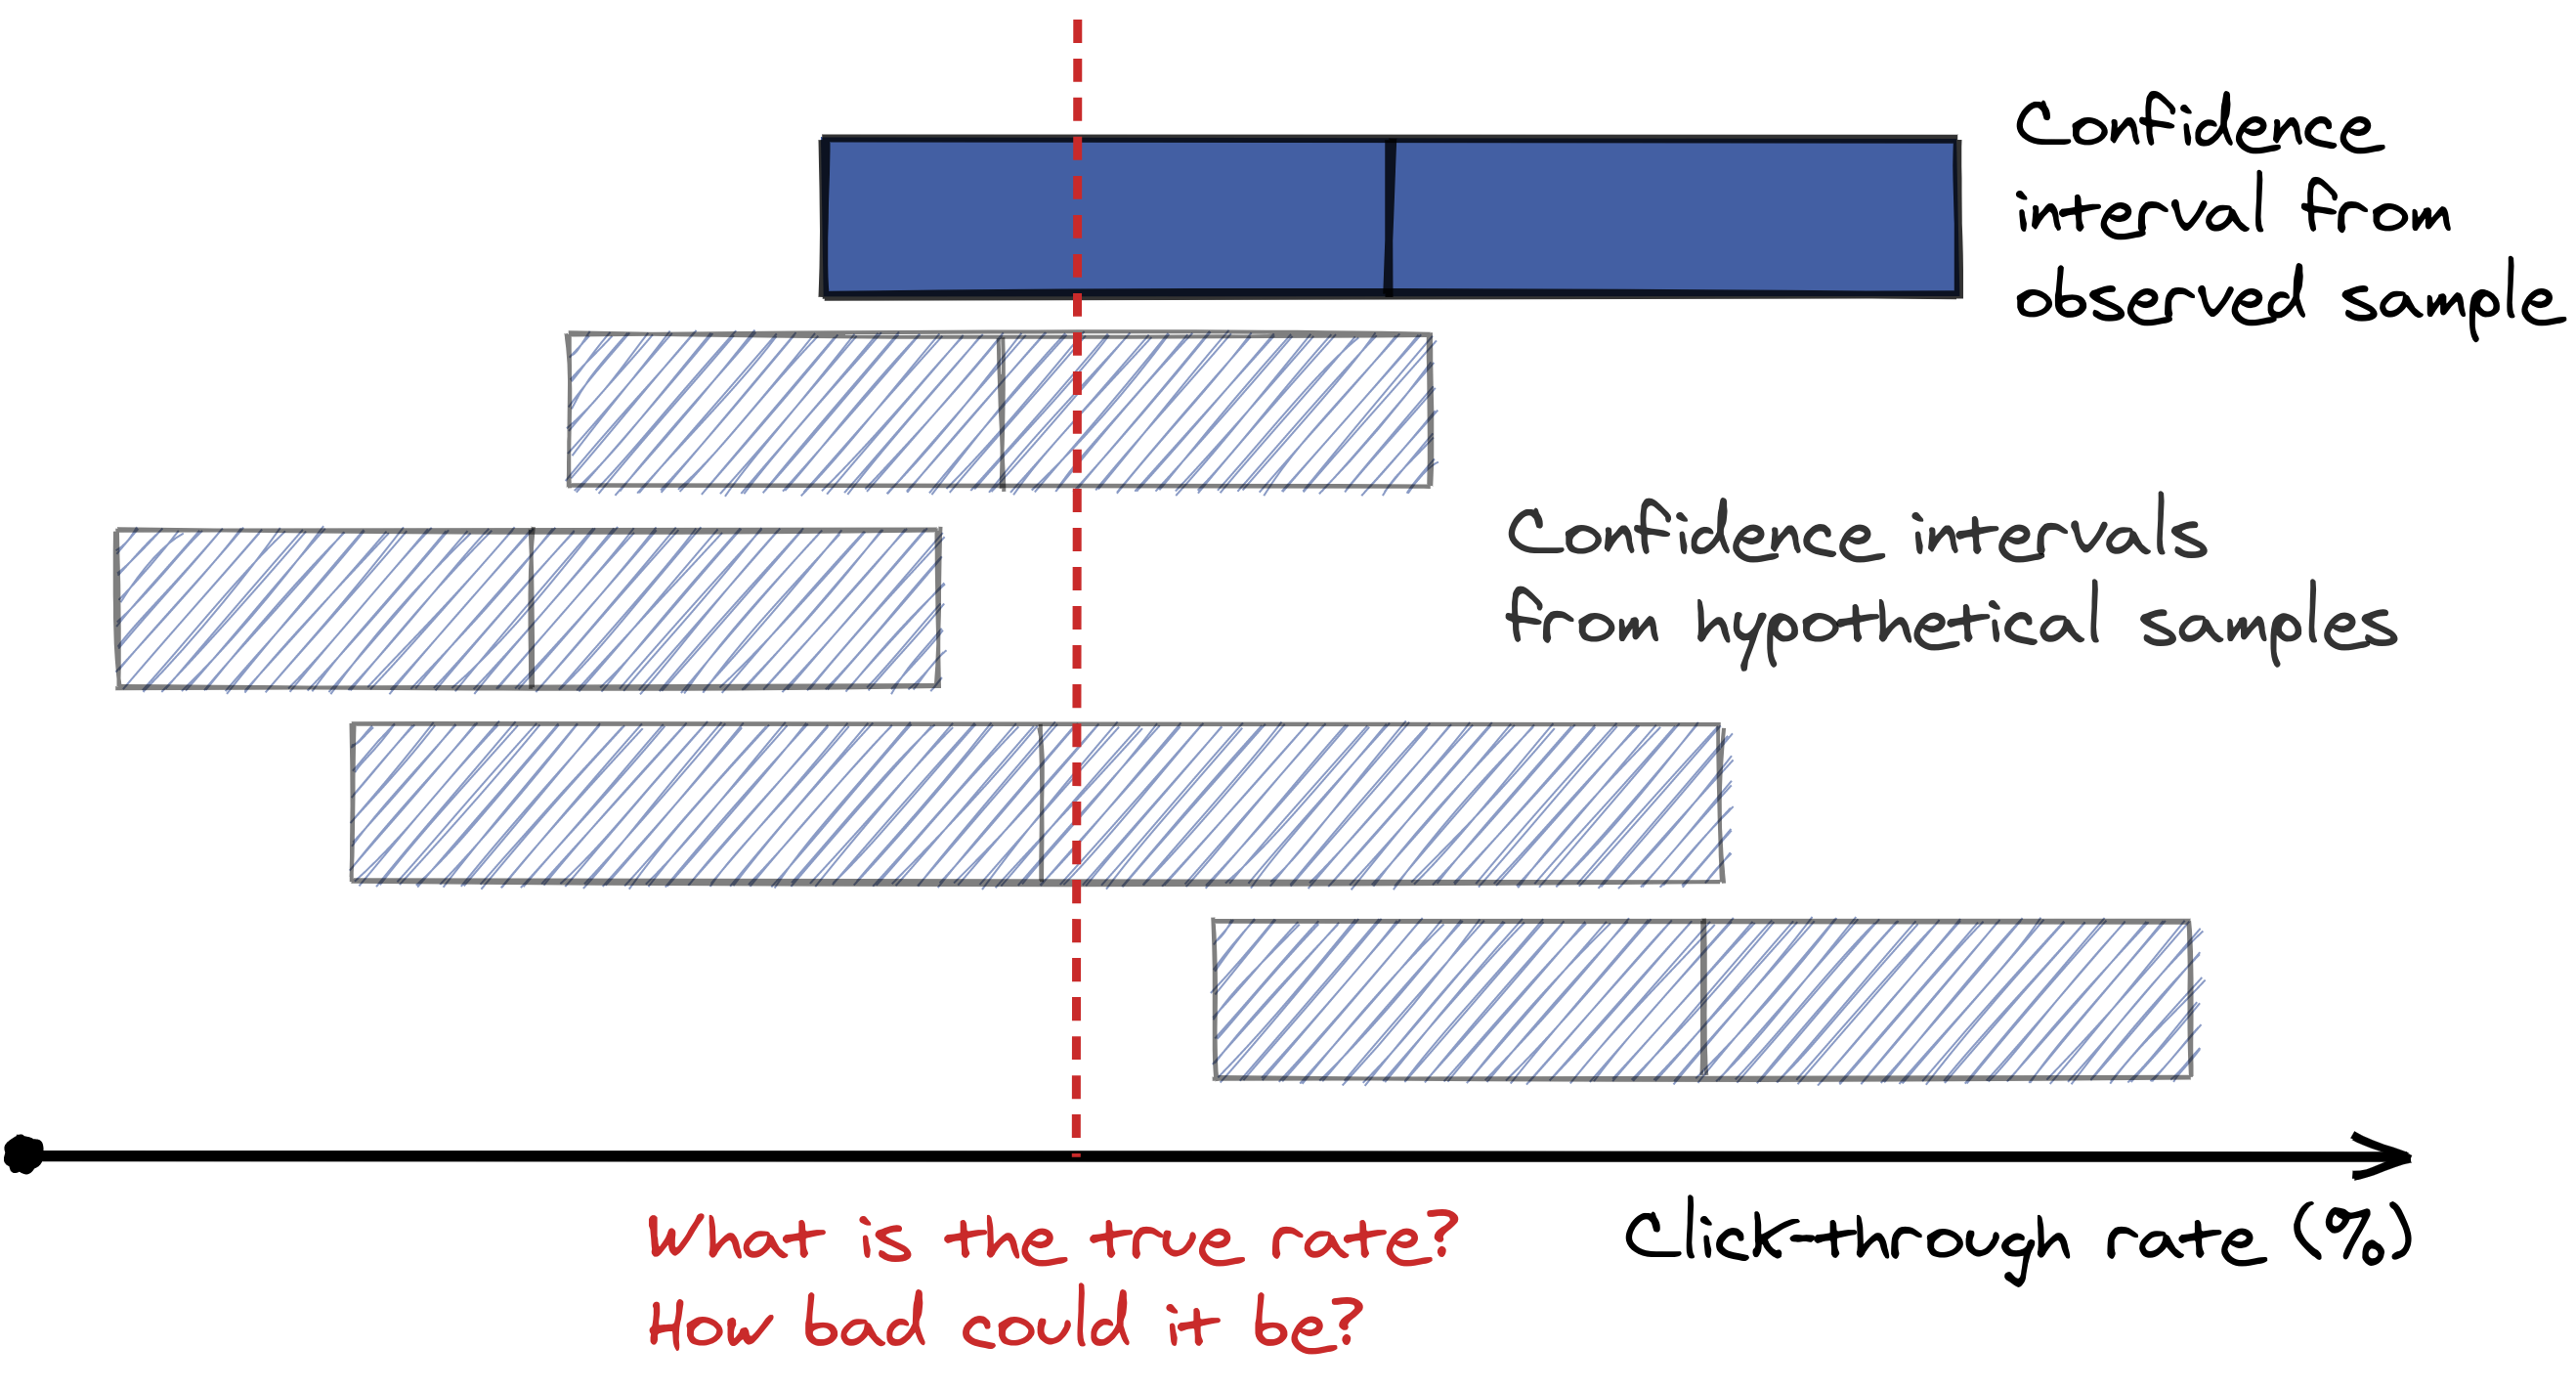
No, your confidence interval is not a worst-case analysis
Confidence intervals are one of the most misunderstood concepts in statistics. Common sense says the lower bound of a confidence interval is a good estimate of the worst-case outcome, but the definition of the confidence interval doesn’t allow us to make this claim. Or does it? Let’s take a look.
In defense of statistical modeling
Data science remains hot but there is a persistent stream of articles that says the field is overhyped and that hiring managers and aspiring data scientists should focus more on engineering. Let’s remember why data science’s core skill of statistical modeling is so valuable.


